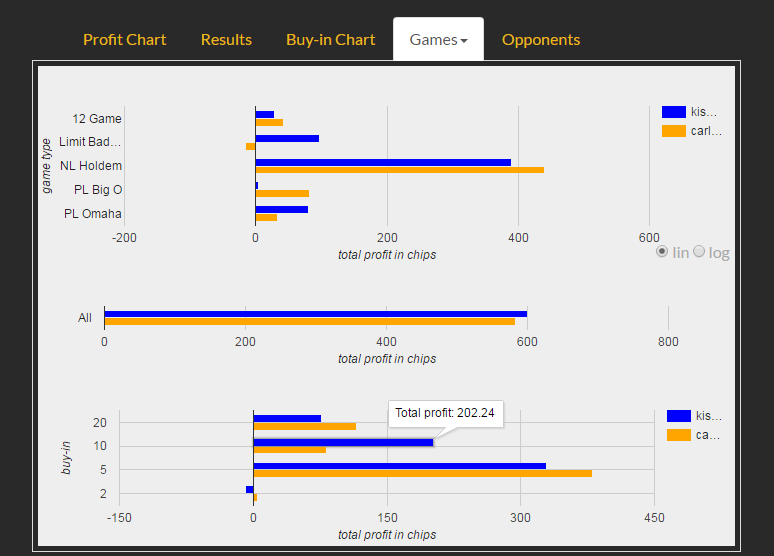
Stats Page
- all tournaments (including MTTs, freerolls and S&Gs) are tracked
- cash games aren’t tracked
- free users have access to the 3 last months of their data
- premium members have access to all their tracked data (MTTs since August 2015, freerolls and S&Gs since December 2015)
Profit Chart
- shows your profit over time
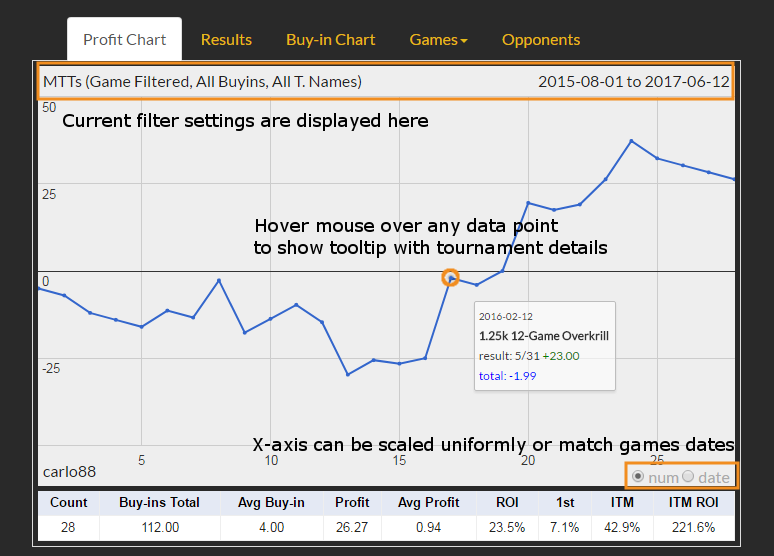
Count – number of games
Buy-ins Total – sum of buy-ins
Avg Buy-in – average buy-in per game (buy-ins total divided by number of games)
Profit – total profit (chips won – buy-ins)
Avg Profit – average profit per game (total profit divided by number of games)
ROI – return of investment (profit/buy-ins * 100%)
1st – percentage of games you finished on 1st place
ITM – in the money, percentage of games you cashed
ITM ROI – in the money return of investment, ROI calculated just for the games you cashed
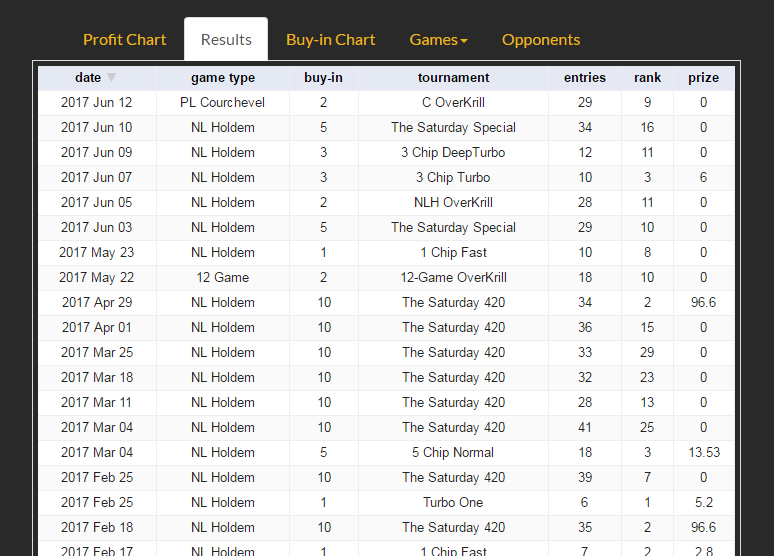
Results
- shows your results in a table format
- you can sort the table by clicking column headers
- click header again to switch sorting to ascending/descending
Buy-in Chart
- available to the premium members
- shows your profit in buy-ins over time
- games you lost make graph drop by 1
- games you cashed make graph go up by amount of buy-ins you profited
- gives you buy-in independent picture of your results, so high buy-in games won’t dominate over a smaller ones
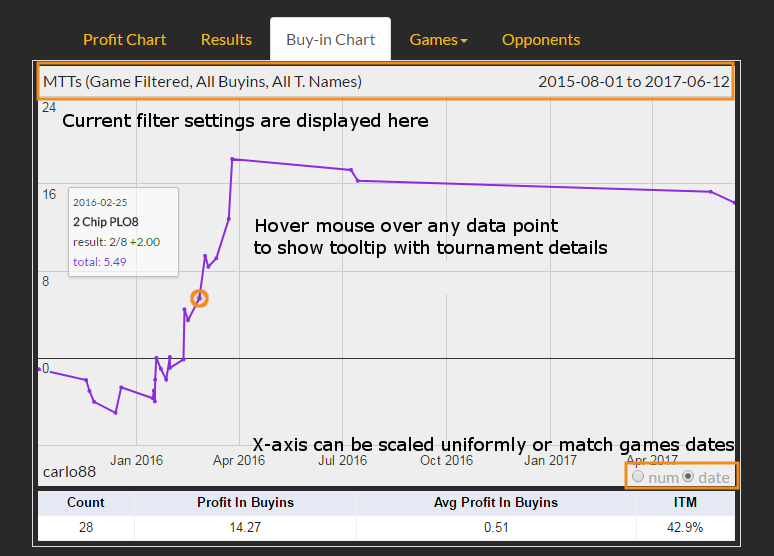
Count – number of games
Profit in Buyins – total profit in buy-ins (buy-ins won – buy-ins paid)
Avg Profit in Buyins – average profit in buy-ins per game (total profit in buy-ins divided by number of games)
ITM – in the money, percentage of games you cashed
Games
- available to the premium members
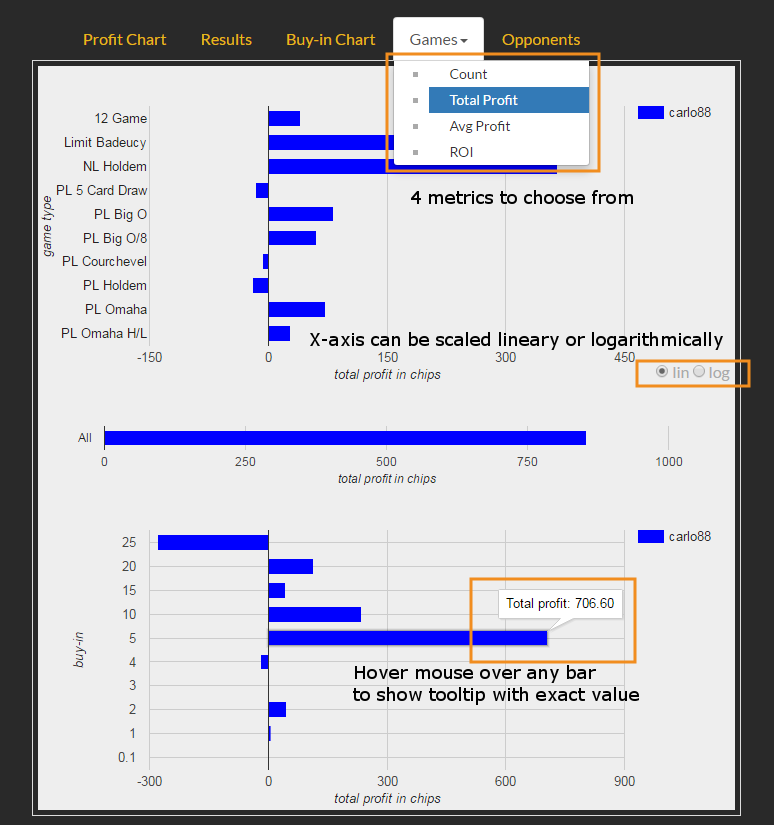
- shows you detailed view of 1 of the 4 metrics: games count, total profit, average profit or ROI
- view consists of 3 bar charts
- 1st chart is detailed breakdown by the game type
- 2nd chart just shows metric value for all games
- 3rd chart is detailed breakdown by the buy-in value
- use those charts to easily see which game types and buy-ins are the most profitable for you
- switch to logarithmic scale to better see small bars when the range is wide
Opponents
- available to the premium members
- shows your 10 most frequent tournament (excluding freerolls) and S&G opponents and how you fare against them
- especially useful to S&G players when making decision to sit or not
- frequent opponents may be worth looking up for more detailed stats
- you can sort the table by clicking column headers
- click header again to switch sorting to ascending/descending
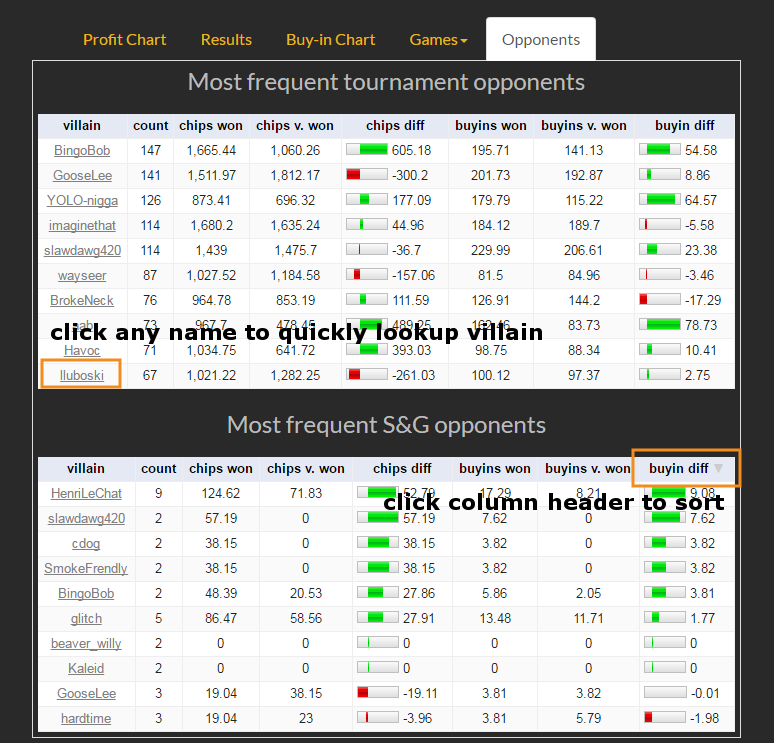
villain – name of your opponent
count – number of games you played together (freerolls are excluded)
chips won – your winnings in those games
chips v. won – villain’s winnings in those games
chips diff – chips difference (your winnings – villain’s winnings), also visualized on horizontal bar, green – you’re better, red – worse
buyins won – buyins you won in those games
buyins v. won – buyins the villain won in those games
buyins diff – buyins difference (buyins you won – buyins the villain won), also visualized on horizontal bar, green – you’re better, red – worse
(buyin columns give you better feel how you do on average, chips columns can be skewed by high buyin games)
Filtering Games
- you can filter games on any tab except Opponents tab
- in tandem with charts it allows you to dive deep into your data, for example view charts just for Omaha games or games in specific buyin range
- charts update automatically when you change your filter settings
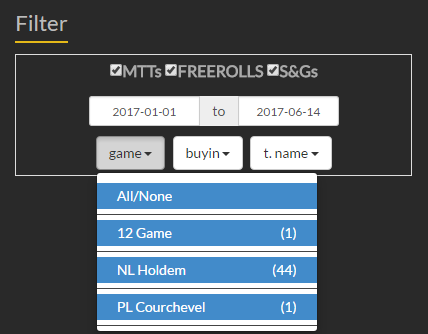
- start by choosing to see just MTTs, freerolls, S&Gs or any combination of them
- then you may select date range you want to see
- then you may select game types you want to include
- then you may select buyins you want to include
- finally you may select specific tournaments you want to include
- use All/None option to quickly select/deselect all
Looking Up Players
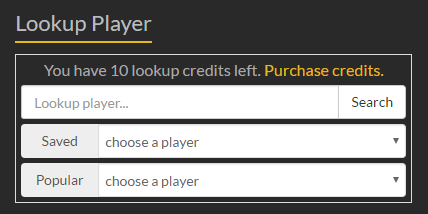
- you can look up any player who hasn’t opted out
- you can view player’s data in the same way you view yours, meaning that as a free user you will have access to last 3 months and basic charts and as a premium member to all tracked data and all charts
- player’s data is available during next 24 hours after lookup and you can access it using “Saved”
selection box
- you can use “Popular” selection box to see the most frequently looked up players
selection box
Comparing Players
- available to the premium members
- works on the Games tab and lets you compare 2 players results across 4 metrics: games count, total profit, average profit and ROI with detailed breakdown by game type and buy-in
- choose players you want to compare from the dropdown lists
- lists contain your name and players you looked up during last 24 hours
- compare yourself with other player or two other players with themselves
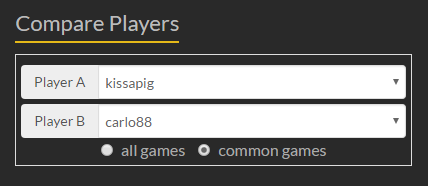
all games – compare across all games in which either of the players played
common games – compare just across games in which both players played
